Know the exact point your business stops losing money.
Enter your fixed costs, your price, and what each unit costs to make. Calcority returns the volume that covers everything, and shows how far that number moves when any one assumption changes.
Building a site? Embed any calculator for freeThree numbers in, one answer out.
Break-even is a subtraction problem, not a forecast. Every unit you sell contributes whatever is left after its own cost. Sell enough of those contributions to cover the bills that arrive whether you sell or not, and you are even.
Price minus variable cost — what one sale actually leaves behind. On your current inputs, that is $38 per unit.
Rent, salaries, software, insurance. Divide that base by the margin and the quotient is your volume.
Move price by five percent and the volume moves by more. That sensitivity is the part worth planning around.
Three numbers in, one answer out.
Enter your numbers
Fixed costs, price per unit, and variable cost per unit. Three numbers, no accounting background required.
See your break-even point
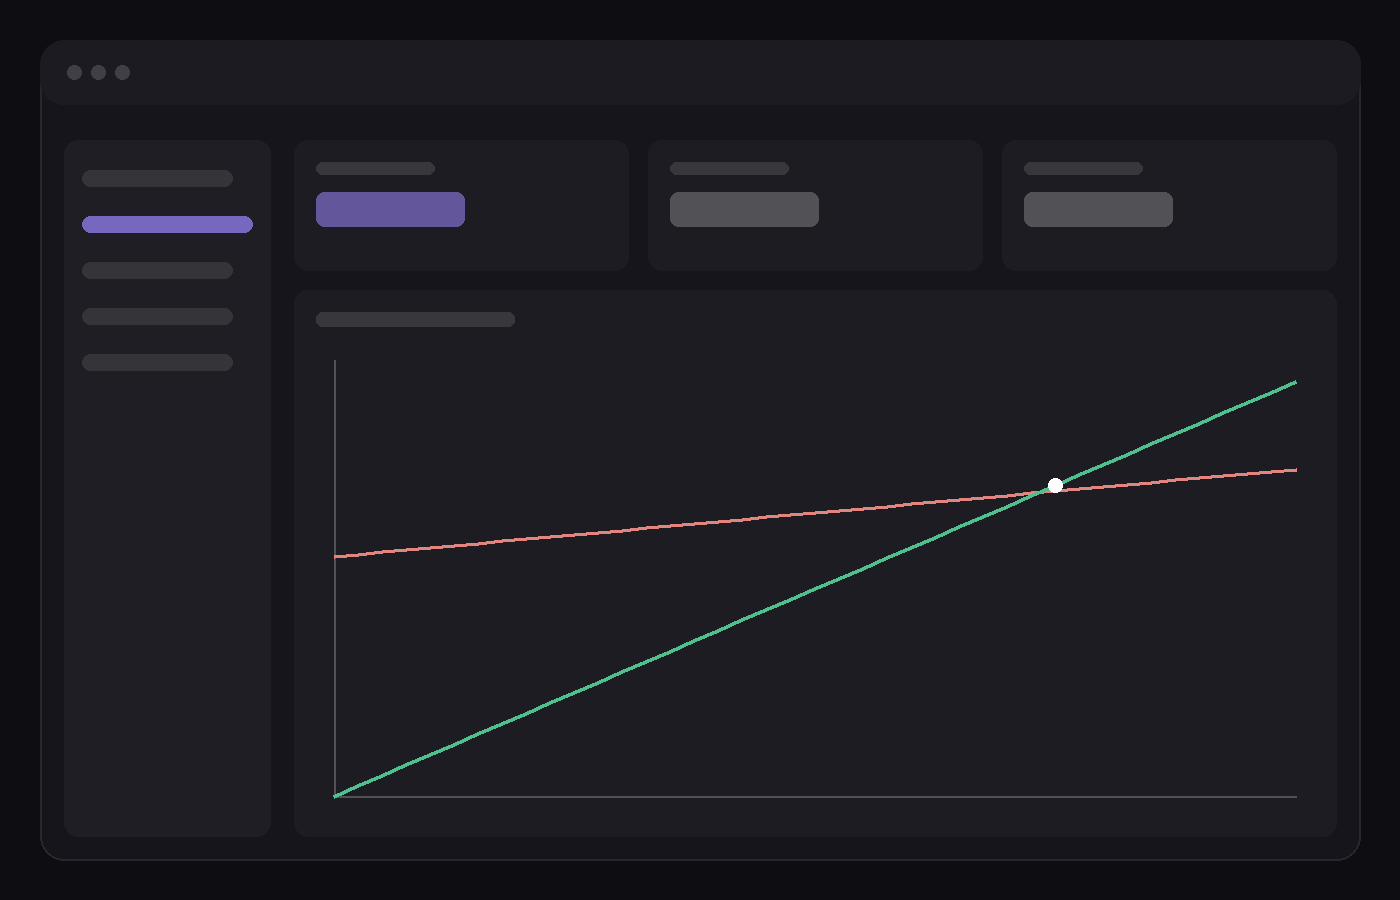
Calcority plots revenue against total cost and marks the exact unit and dollar figure where the lines cross.
Save and compare scenarios
Test a price increase or a cheaper supplier side by side, and see which one moves your number further in your favor.
Cost and revenue plotted against volume — the dot marks the unit where they cross.
What a price change actually costs you.
Built live from the inputs above. Change any one of them and every row recalculates.
Weight several SKUs by sales mix for a blended break-even across the whole catalogue.
Layer growth onto the volume and see which month the two lines finally cross.
One link carrying the chart, the assumptions, and a plain-language read for a lender or board.
Keep base, best, and worst side by side instead of overwriting a spreadsheet tab.
Why not just use a spreadsheet?
Three reasons founders switch off Excel for this specific number.
One formula, always right
No broken cell references after the fifth edit.
See it, don't just compute it
The crossing point, live, not a static cell.
Nothing to set up
No template to find, copy, or fix first.
Every scenario, saved where you can actually compare them.
Sign in and every calculator gets a save button. Base case, best case, worst case — laid out side by side instead of three tabs of the same spreadsheet with slightly different numbers in them.
Stop guessing at the number that decides everything.
Free forever for a single product. Paid plans add multi-SKU models, saved scenarios, and shared links.
Break-even calculator
Find the exact unit and dollar where revenue finally overtakes cost.
at $8,000 fixed costs
Contribution margin calculator
See what's actually left from each sale once variable costs are paid.
73% ratio
CVP calculator
Break-even, target profit, and margin of safety — in one live tool.
for $7,000 target
Every calculator, grouped by the question you're actually asking.
92 free tools, one shared engine. No account needed to run any of them. Open the directory →
Put a real calculator on your own site. No cost, no signup.
Break-even, cap rate, runway, DSCR, and nine more — pick one, paste it into a blog post, resource page, or client portal, and it stays live and up to date automatically.
Built for anyone who'd rather calculate than guess.
The formulas don't change by industry, but which number matters first usually does.
Know your runway before it knows you.
Model burn, hiring, and pricing decisions before you make them, not after the bank balance tells you. Runway, SAFE conversion, and unit economics live under one roof so a fundraise model and a pricing model share the same assumptions.
The MRR waterfall, without a subscription to another dashboard.
Net new MRR, quick ratio, and retention in one free calculator, plus the break-even and CVP tools that plug the resulting margin back into a pricing decision.
Price a project like a business, not a guess.
Turn a day rate into a real break-even number, check whether a client is worth keeping at your current DSO, and compare what a 1099 rate should actually be against a W-2 offer.
Markup, margin, and reorder points that stay in sync.
Convert markup to margin without a lookup chart, see the exact volume a markdown needs to break even, and find the reorder point before you're either overstocked or out of stock.
Why people stick with it
Know your number instantly
No signup, no spreadsheet setup, no waiting.
Built on real formulas
Every calculator shows its formula in full on the page, not a black box.
Free to start
The core calculators are free forever, not a 14-day trial.
Compare before you commit
See how a price change moves your break-even point before you actually change the price.
Nothing to install
Runs in the browser, on any device.
Your data stays yours
Saved scenarios are access-controlled to your account alone.
From the blog
All guidesPricing
Start free. Upgrade only when you need to save or export.
Free
- Unlimited calculations
- Live break-even chart
- Save scenarios
- Multi-product break-even
- PDF / Excel export
Pro
- Everything in Free
- Unlimited saved scenarios
- Multi-product break-even
- CSV import
- PDF / Excel export
Frequently asked questions
Start with break-even if you just need one number. Use contribution margin if you're comparing pricing on a specific product. Use the CVP calculator if you want a profit target, not just the break-even floor, or want to see your margin of safety at the same time.
Yes. Every calculation and every live chart on every calculator is free with no signup. An account is only needed to save scenarios, run multi-product break-even, or export results.
No, not to calculate anything. You only need one to save a scenario for later or come back to compare numbers you've already run.
Numbers you enter to calculate stay in your browser unless you explicitly save a scenario while signed in. At that point they're stored under your account and access-controlled at the database level, not shared or visible to other users.
The free calculators are built for a single product or service. Multi-product break-even, using a weighted-average contribution margin across your product mix, is a Pro feature.
92 free calculators, grouped into pricing and profitability, break-even by industry, cash and runway, team and hiring, SaaS and startup metrics, real estate, and valuation, tax and legal. The full list, with a search box, is on the calculators page.
Yes. Every calculator, chart, and saved scenario works the same on a phone as it does on a desktop, since the inputs are simple number fields and the math runs in your browser either way.